Data Lists
Load rows of data into a button and cycle through them automatically, updating your graphics one row at a time.
Data Lists let you load rows of data into a button and cycle through them automatically, updating your graphics one row at a time. They're ideal for player rosters, sponsor rotations, election results, leaderboards, or any scenario where you need to display a series of items sequentially.
How Data Lists work
A Data List is a special button type in Helmo Control. Instead of triggering a single action, it holds a table of data rows and sends them one by one to your connected graphic or integration.
When you run a Data List, Helmo Live:
- Takes the first row of data
- Sends it to your connected graphic (Helmo Graphics, Flowics, or any integration)
- Triggers the IN animation
- Waits for the duration you set
- Triggers the OUT animation
- Moves to the next row and repeats
This continues until all rows have been shown, or you can set it to loop continuously.
Creating a Data List
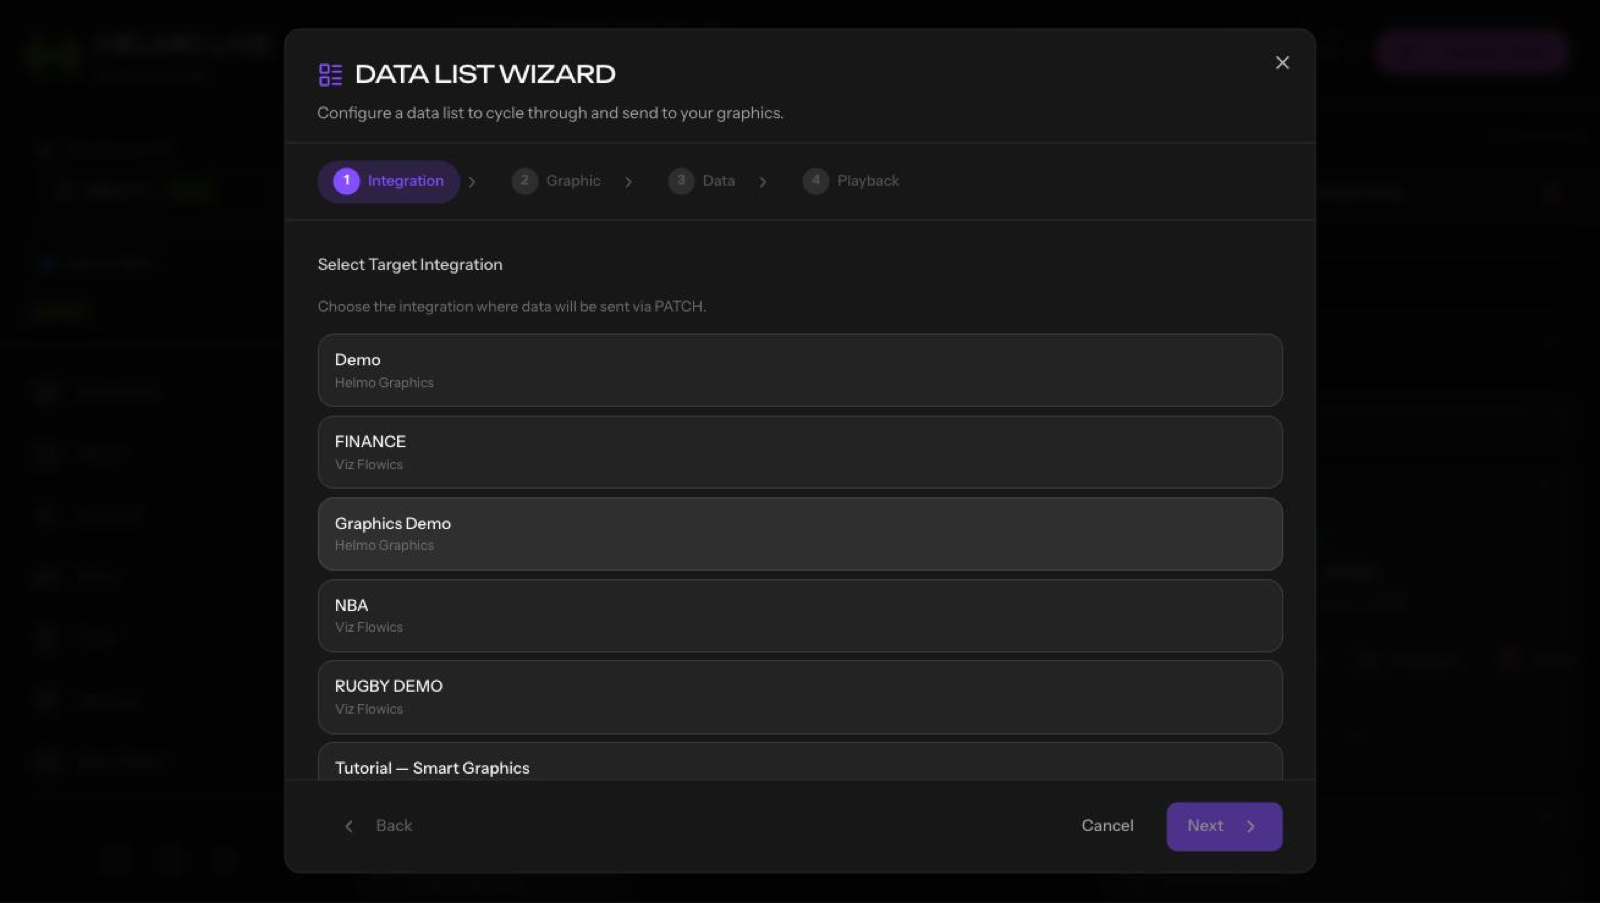
- Open Control Builder and select a Control Page
- Click Add Button and choose the type Data List
- Give it a name (e.g., "Player Roster" or "Sponsor Rotation")
Adding data
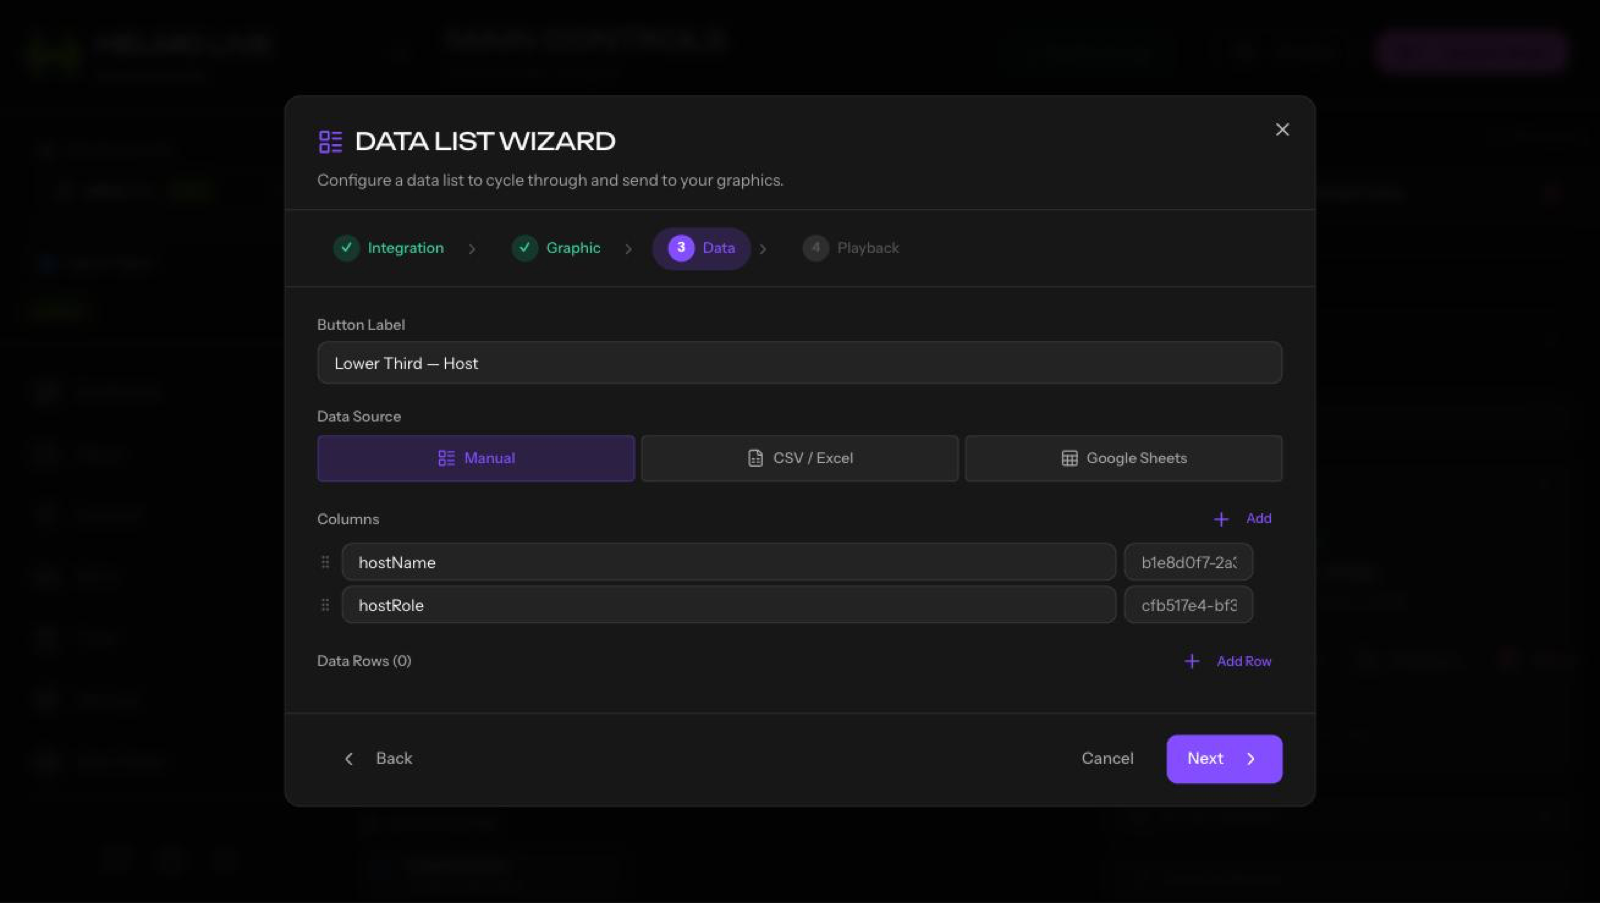
You can populate a Data List from several sources:
- Manual entry: type rows directly in the editor. Great for quick setups or one-off shows.
- CSV / Excel import: upload a
.csvor.xlsxfile. The first row is used as column headers. - Google Sheets: connect a Google Sheet and Helmo pulls the data live. Changes to the sheet are reflected automatically.
- REST API: point to any JSON endpoint. Helmo fetches and maps the data.
Each column in your data maps to a field in your graphic. For example, a "Name" column maps to the name text field, a "Title" column maps to the title field, and so on.
Connecting to a graphic
After adding your data:
- Select the integration the Data List should control (Helmo Graphics, Flowics, etc.)
- Map columns to fields: tell Helmo which data column goes to which graphic field
- Set the IN action (how each row appears) and the OUT action (how it exits)
Playback settings
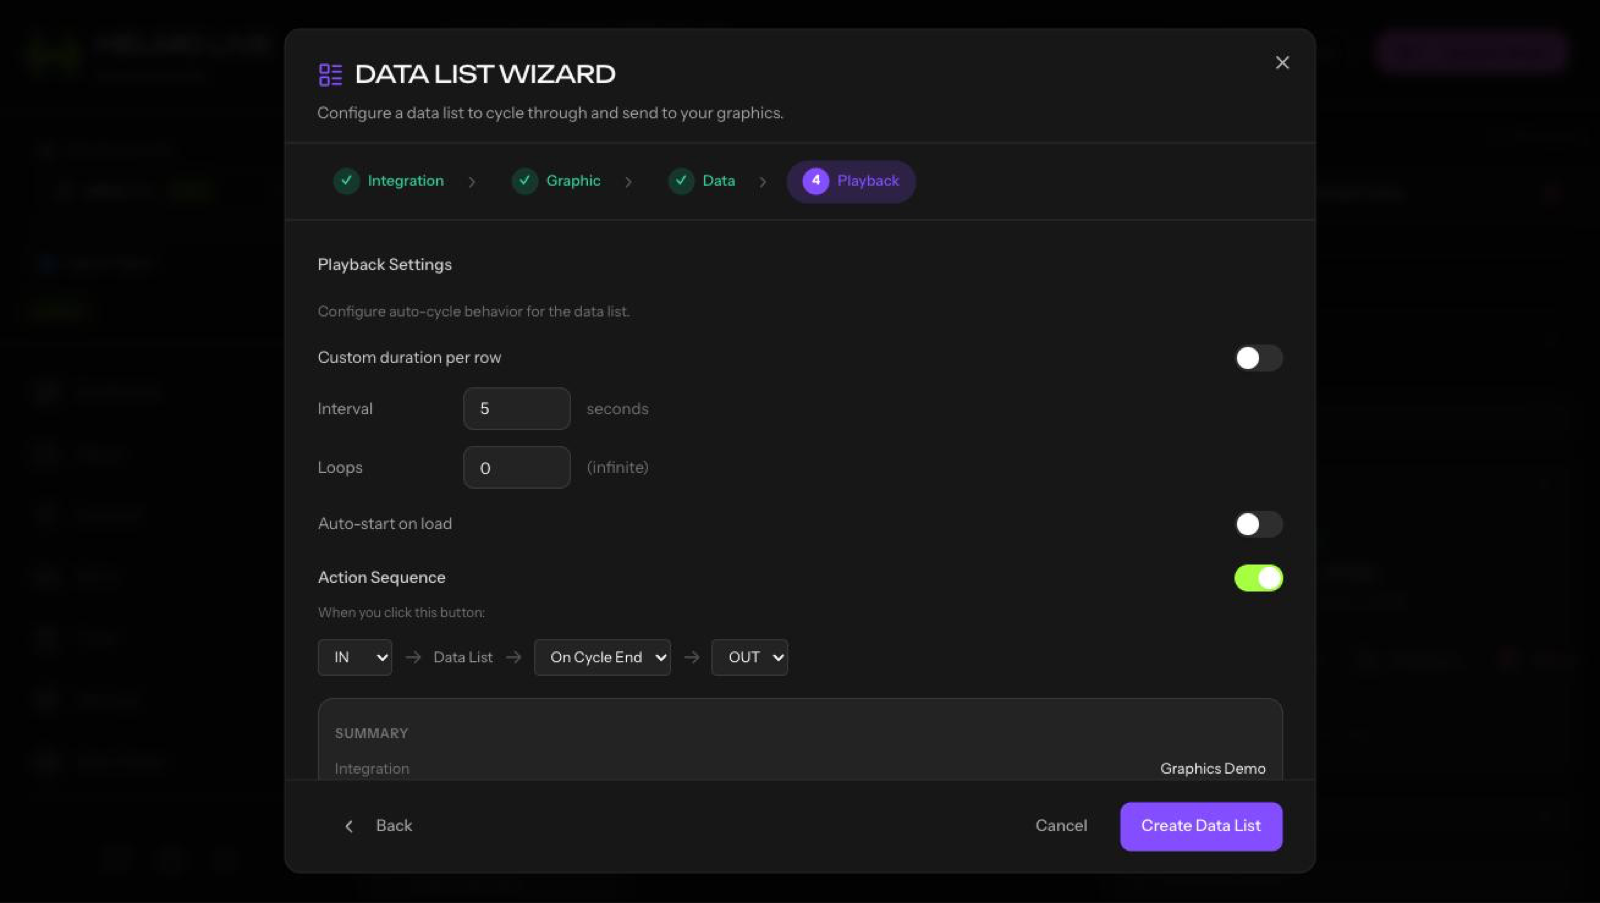
Data Lists give you fine control over how rows are displayed:
- Duration per row: how long each row stays visible (e.g., 5 seconds, 10 seconds)
- Loop: when enabled, the list repeats from the beginning after the last row
- Loop count: set a specific number of loops, or leave it on infinite
- Progress bar: shows a visual indicator of how far through the list you are
- Action Sequences: you can attach a full Action Sequence to each row transition, adding PATCH steps, WAITs, or multi-integration triggers between rows
Operating a Data List
From the Control Client:
- Tap the Data List button to start playback
- The list cycles through rows automatically based on your duration settings
- Use the pause control to hold on the current row
- Use skip to jump to the next row manually
- Use stop to end playback and trigger the OUT animation
You can also trigger Data Lists from Helmo Rundown: add a Data List as an Element inside a Story, and it will execute automatically as part of your show flow.
Use cases
- Sports: cycle through a starting lineup with player name, number, and position
- Elections / Voting: show candidate results one by one with vote counts
- Sponsors: rotate sponsor logos and messages during commercial breaks
- Esports: display team rosters, match stats, or tournament brackets
- Church / Events: cycle through announcements, song lyrics, or schedule items
- News: rotate headlines, weather forecasts, or stock tickers
Tips
- Google Sheets as a live source: if you're running a sports broadcast, have a stats operator update the Google Sheet in real time while the Data List cycles on air.
- Action Sequences per row: for maximum impact, attach an Action Sequence that does IN, PATCH all fields, WAIT, OUT for each row. This ensures clean transitions.
- Test with 2-3 rows first: before loading a 50-row roster, test your timing and field mapping with a small dataset.
- Progress bar for producers: enable the progress bar so your control room knows how far through the list you are.